Sometimes I browse Twitter at work, okay? Code needs time to compile.

Occasionally I noticed I was randomly getting taken back a page if I clicked out of viewing an individual tweet. This was really irritating because I like to read all the tweets posted overnight, so the bug would force me to scroll through many hours of tweets to find my place again.
There's only so many times you can think "I must have right-clicked and pressed 'back' on the context menu" before you decide to investigate. After a bit of poking I figured out how to reproduce it: if you click on a tweet to bring up the details lightbox (where the background is grayed-out) and double-click outside to try to return to the timeline then boom, the bug will trigger.
It seemed like a problem with Twitter. But it was also kind of bizarre; how does clicking on a UI element take me back a page? Could it be a bug in Chrome? Plus the bug didn't reproduce in Edge or Firefox, which furthered my suspicion. It shouldn't be hard to confirm one way or the other, I thought. I have a debug build of Chromium right here! I'll just slap some breakpoints around and see what happens.
First I tried stopping the page in an onbeforeunload handler by popping up an alert. But it turns out that's quite a controversial event. Scammers really like having the ability to stop people from leaving their site and so browsers do their best to foil that. You get one default alert message and that's it.
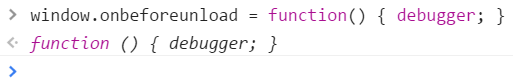
However… using the debugger statement ought to work. You have to have the devtools open for it to do anything, so the browser normally allows you to stop there. It just… doesn't, not on Twitter at least. Weird.
Okay, no big deal. My next idea was to find where in Chromium onbeforeunload is triggered, put a breakpoint there, fire up my debug build, and see where it came from. After a little digging around I came up with EventTarget::
I pressed the back button and hit the breakpoint. I got a stack trace like this: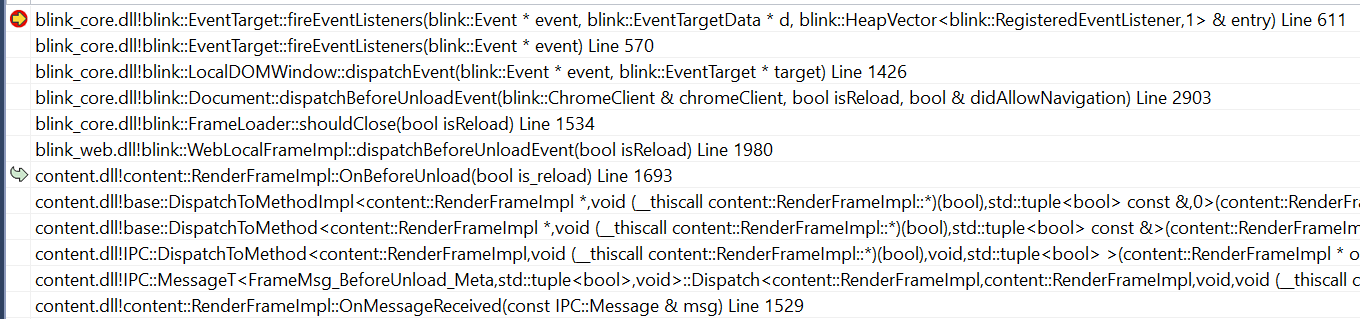
Short digression about Chromium's architecture: EventTarget is a class in Blink (formerly Webkit) which is run in a separate per-page "renderer" process to keep the website code isolated from the main "browser" code. The browser has more privileges so it's important to put a wall there.
So when you see a stack trace like this, with all that IPC (Inter-Process Communication) nonsense in there, it means the renderer process got a message from another process (usually the browser process). Luckily if you move to the OnMessageReceived frame you can see the name of the message we got. In this case FrameMsg_BeforeUnload.
Typically IPC messages are only sent from one or two places, so it's not hard to just search for that event name (using Chromium's handy Code Search tool) and put a breakpoint there instead. In this case, I found RenderFrameHostImpl::window.: another IPC message! This time it was ViewHostMsg_GoToEntryAtOffset, which comes from the renderer.
Yes, that means the renderer is sending a message to the browser which sends a message right back to the renderer. I doubt there's a deep philosophical reason for this other than it was convenient to write.
Chasing ViewHostMsg_GoToEntryAtOffset led me to FrameLoaderClientImpl::
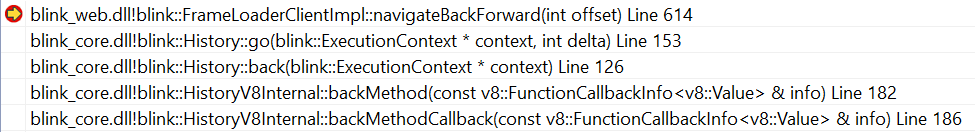
That's what I was looking for! We can't get any closer to actual JavaScript without stepping into V8 (Chromium's JavaScript engine) itself, but that wasn't necessary. At this point I asked myself, what happens if I keep this breakpoint but trigger the bug in Twitter instead? I envisioned two outcomes:
- The breakpoint is hit with a similar stacktrace. Twitter itself is telling us to go back in JavaScript. That would mean it's a bug in Twitter's website.
- The breakpoint is not hit, or is hit with a very different stacktrace. That would mean either I missed something or it's a bug in Chromium.
I loaded up Twitter in my debug build (very slowly, as it's not exactly a speedy site even on optimized release builds) and triggered the bug. Here's what I got:
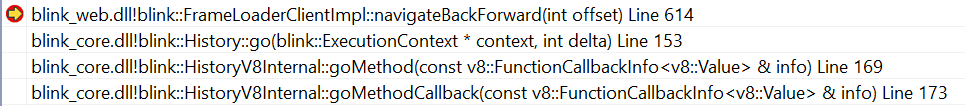
It's very similar to the last stacktrace, which means Chromium is in the clear. It uses history. instead of history. but that has the same effect.
The sluggishness of the site let me notice something else very important: when I triggered the bug I first saw the lightbox disappear and I returned to the timeline. Then after a short delay the breakpoint was hit.
Suddenly it all clicked in my head. Twitter has probably modified its history such that going back returns you to the timeline. Then when you click outside the lightbox it just goes back instead of doing any UI manipulation itself. So when I double-click it runs the click handler twice. Once taking me to the timeline… and once leaving Twitter.
Just to confirm I downloaded Twitter's minified JavaScript (right-click→Save As is occasionally useful). Since window. is an API call it can't be obfuscated. Indeed I found these bits of code:


That seems like what I'm looking for. history is populated with window. when that feature is available. It's hard to tell where the uiOverlayNavigateBack event is coming from, but there are click event handlers scattered about and one of them probably routes here. It's hard to get any more information without Twitter's real source, since reading minified JavaScript is so painful. I'm still curious as to why it doesn't reproduce on Firefox/Edge. But mystery (basically) solved!
The final step was to file a bug with Twitter. There's no way to track the status of the bug so that's all I've got for now, unless a Twitter developer reads this and replies.